
ACCESO AL PANEL DE ESTADÍSTICAS DE LA COLECCIÓN 1.0 [ENLACE]
ANÁLISIS DE LA EXACTITUD DEL MAPEO DE LA COBERTURA Y USO DEL SUELO DEL PROYECTO MAPBIOMAS
Validation was performed for the classifications of the years 1986, 1991, 1996, 2001, 2006, 2012, 2018 and 2022 following the good practices recommendations proposed by Olofsson et al. (2014) for area and error estimation. A total of 2,330 samples were defined as necessary for the analysis. The number of samples for each class was proportional to the area of each class obtained from Collection 1 for the year 2010. Independent samples were raffled and class classified by visual interpretation of Landsat images, very high-resolution images from Google Earth and time series of vegetation indices. Two interpreters evaluated each of the sample points generated from the stratified random design. In those sample points where discordance in class classification was detected among interpreters, a third interpreter defined the final class assignment. When a final class could not be defined by the three interpreters (e.g. three different class assignments), a final class was agreed by a team of interpreters. More details of the validation methodology are described in Baeza et al. (2022).
The results of the accuracy analysis for the different years analyzed in collection 4, as well as their comparison with previous collections, can be seen in the following report.
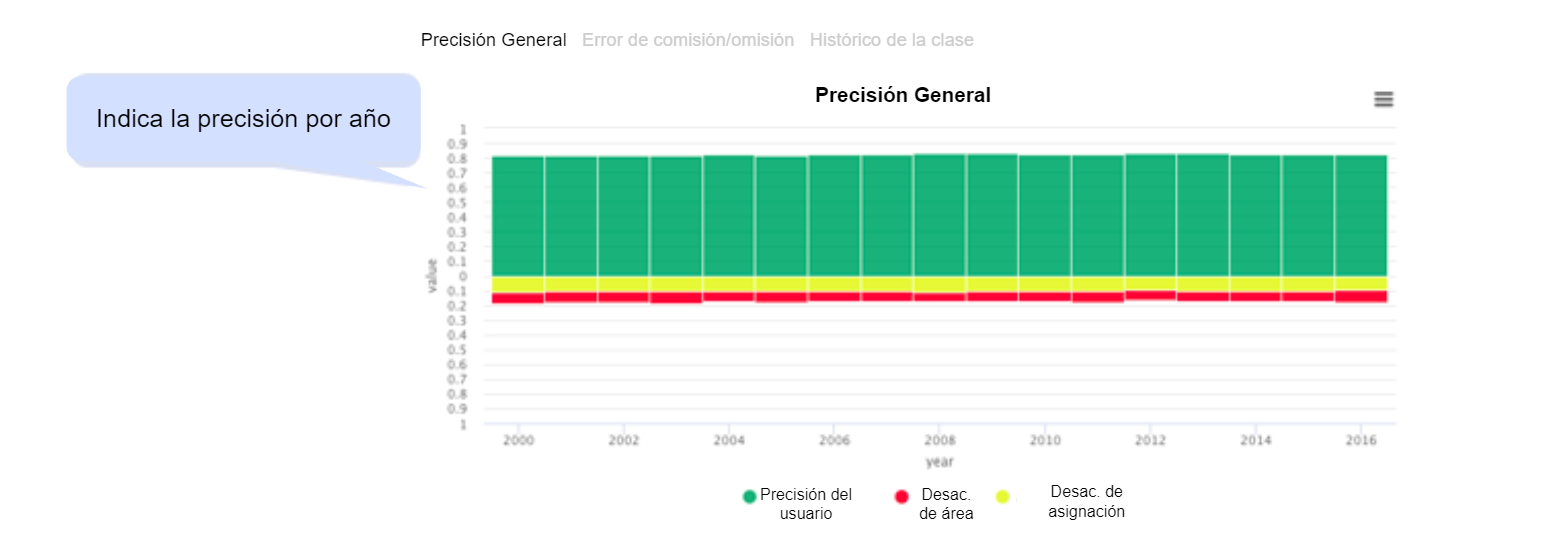
Mostrar la precisión total anual promedio y el error descompuesto en desacuerdo de área y de asignación.
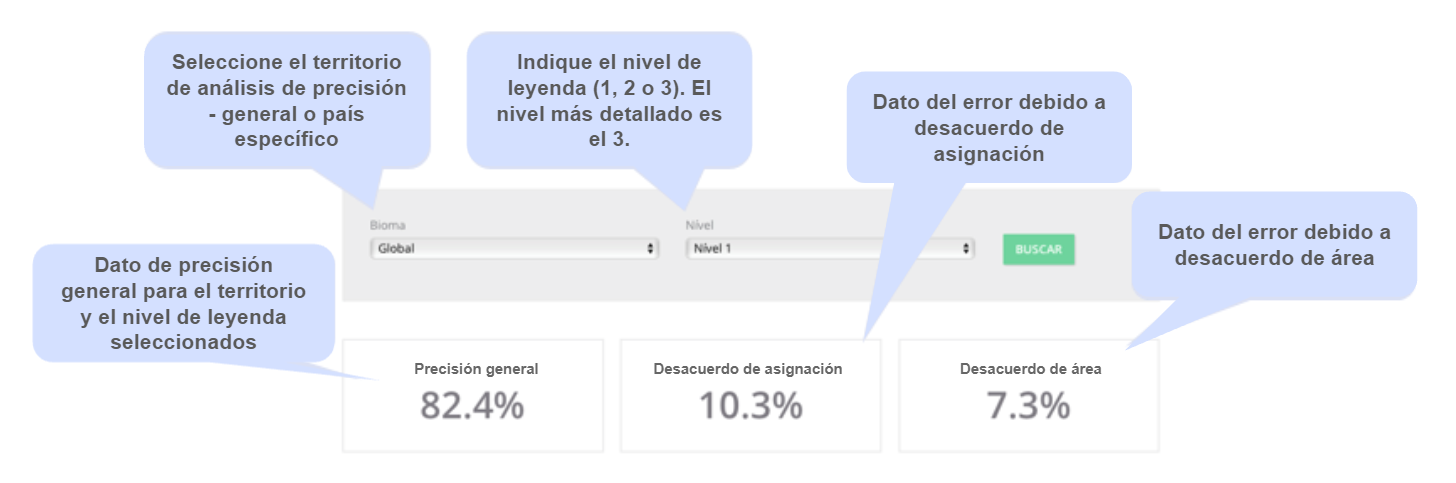
Este gráfico muestra la precisión total y el error total por año. El error total se desglosa en desacuerdo de área y desacuerdo de asignación. La precisión se representa en la parte superior y los errores en la parte inferior del gráfico.
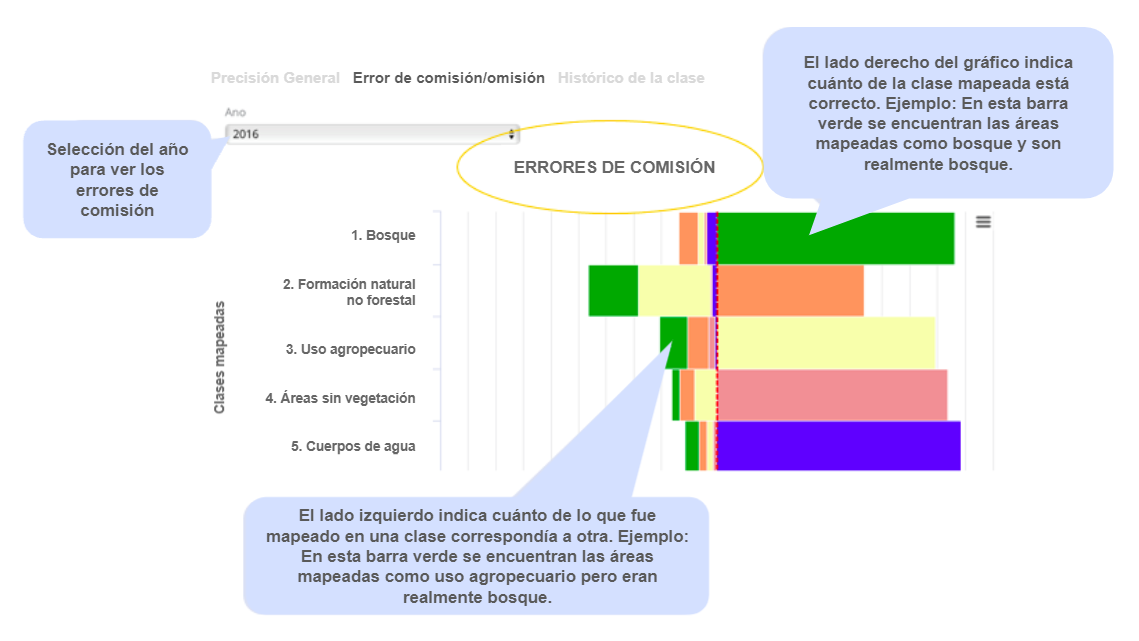
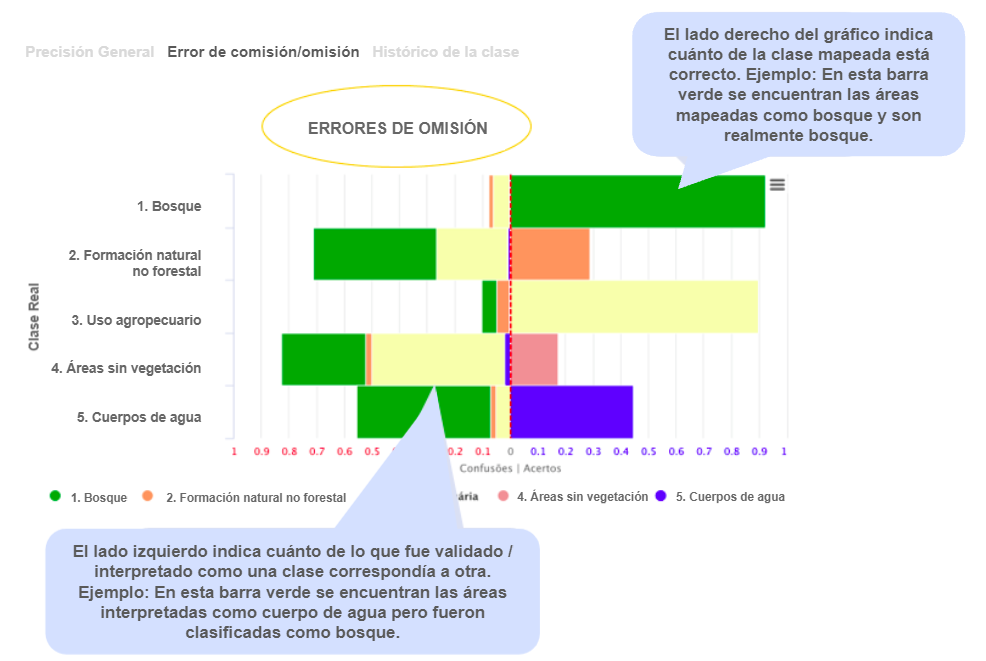
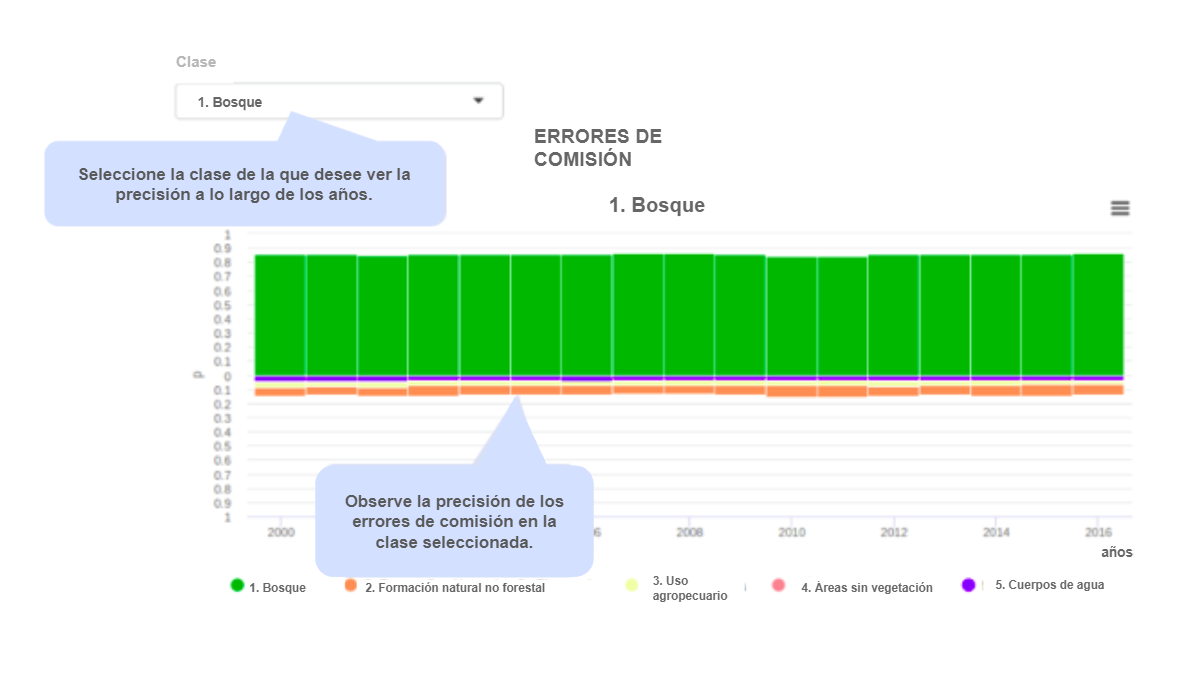
Este gráfico muestra la precisión del usuario, el productor y la confusión entre clases, para cada año. El primero muestra las confusiones de cada clase asignada. El segundo muestra las confusiones de cada clase real.
Este cuadro le permite inspeccionar las confusiones de una clase en particular a lo largo del tiempo. Se muestra la precisión del usuario y el productor para cada clase, junto con las confusiones en cada año.
ACCESO AL PANEL DE ESTADÍSTICAS DE LA COLECCIÓN 1.0 [ENLACE]